When building a Power BI report, it's important to take screen space into consideration. You don't want an overcrowded report canvas that makes it tough for your decision-makers to find the actionable insights they need to make their decisions.
That being said, a valuable skill to learn in Power BI is showing or hiding visuals in Power BI Dashboards at the click of a button. Follow the steps below to achieve this.
Step 1: Add a couple of visuals to your canvas
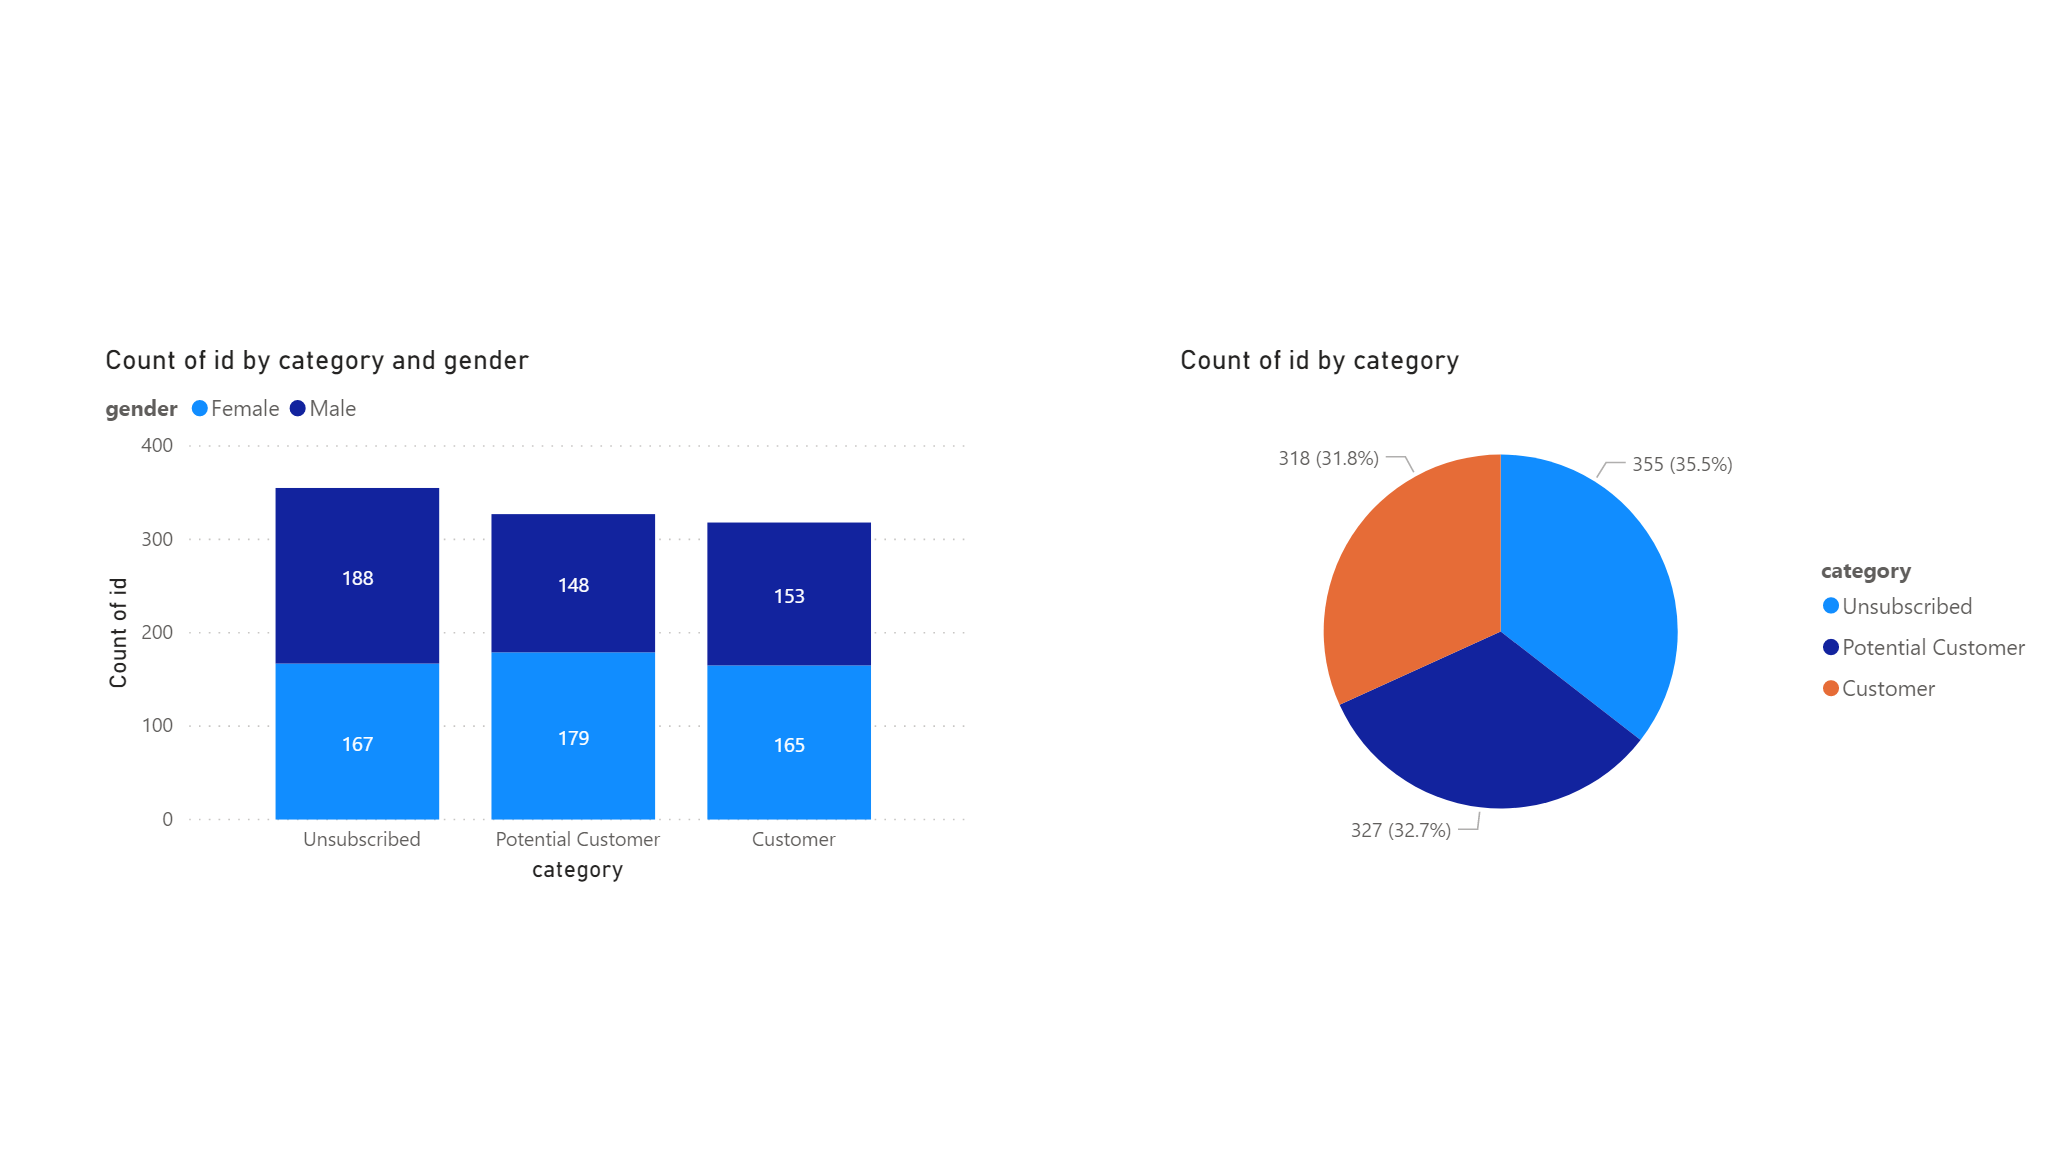
For the sake of my demo, I've added 2 visuals of different types to opposite ends of the canvas. One is a pie chart, one is a bar chart.
Step 2: Add two blank buttons to the canvas
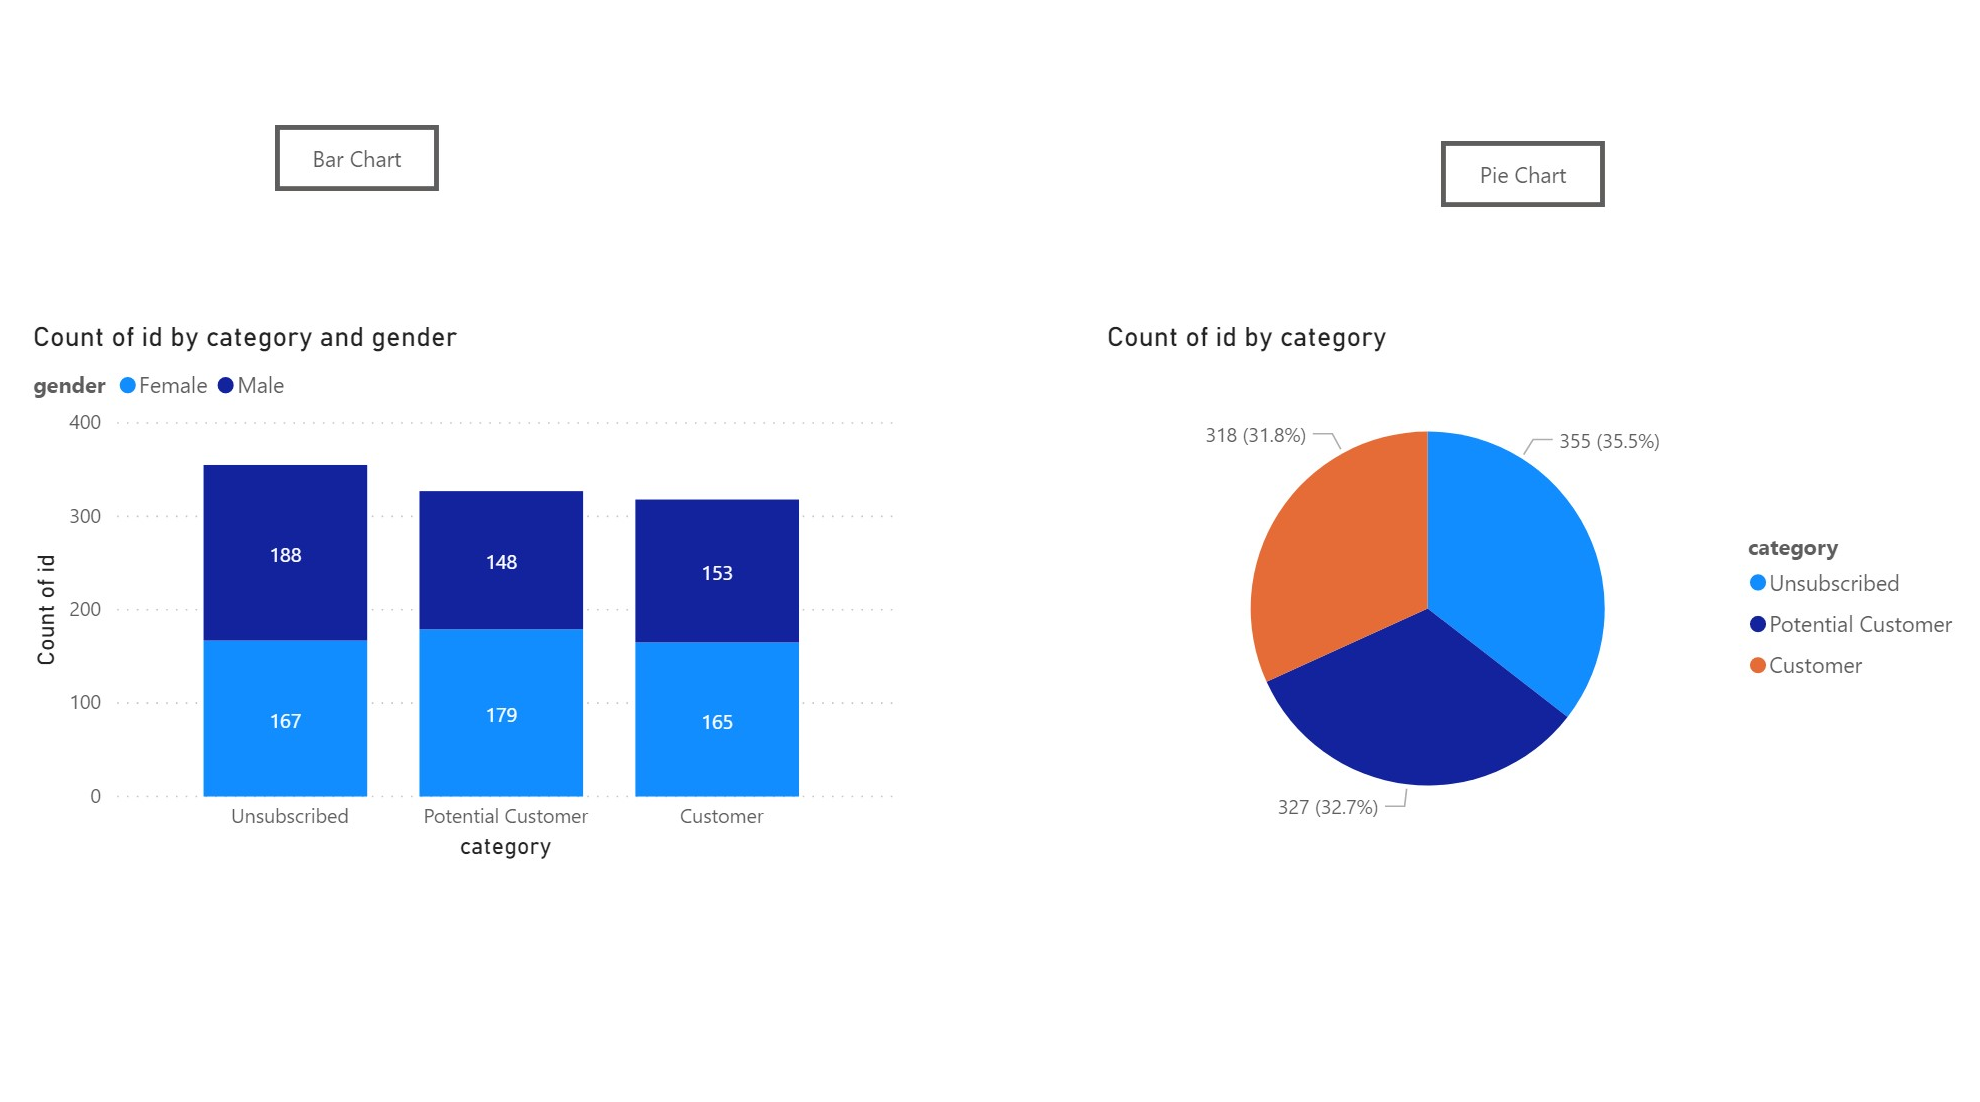
Add each button above the visual you want to show with that button. In my example, I am naming one button Pie Chart and one Bar Chart.
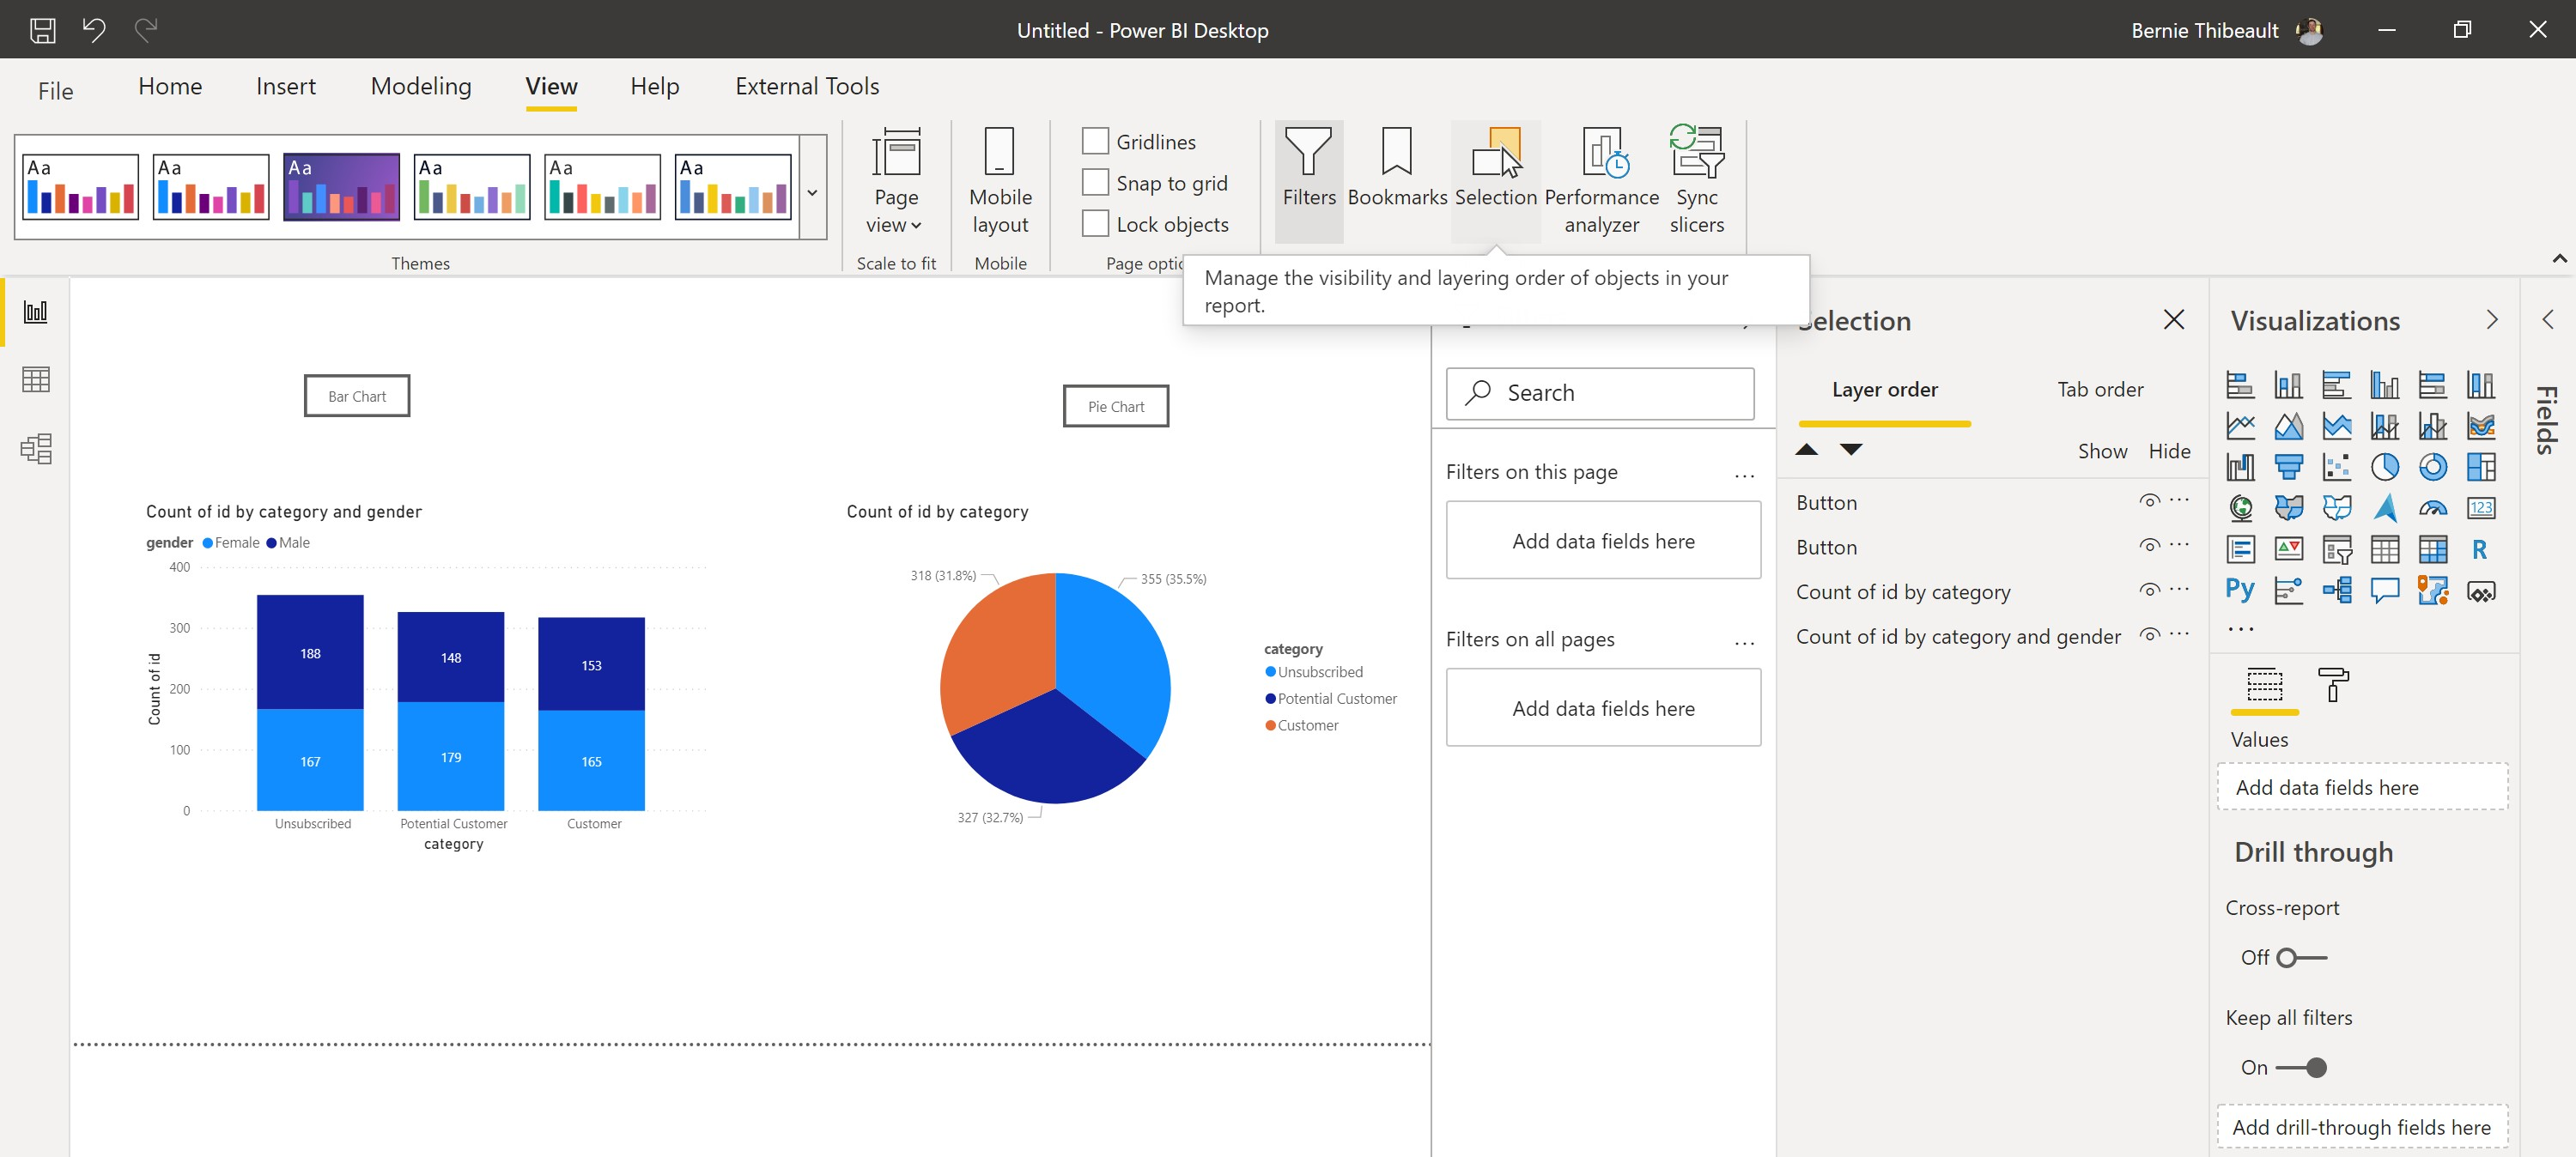
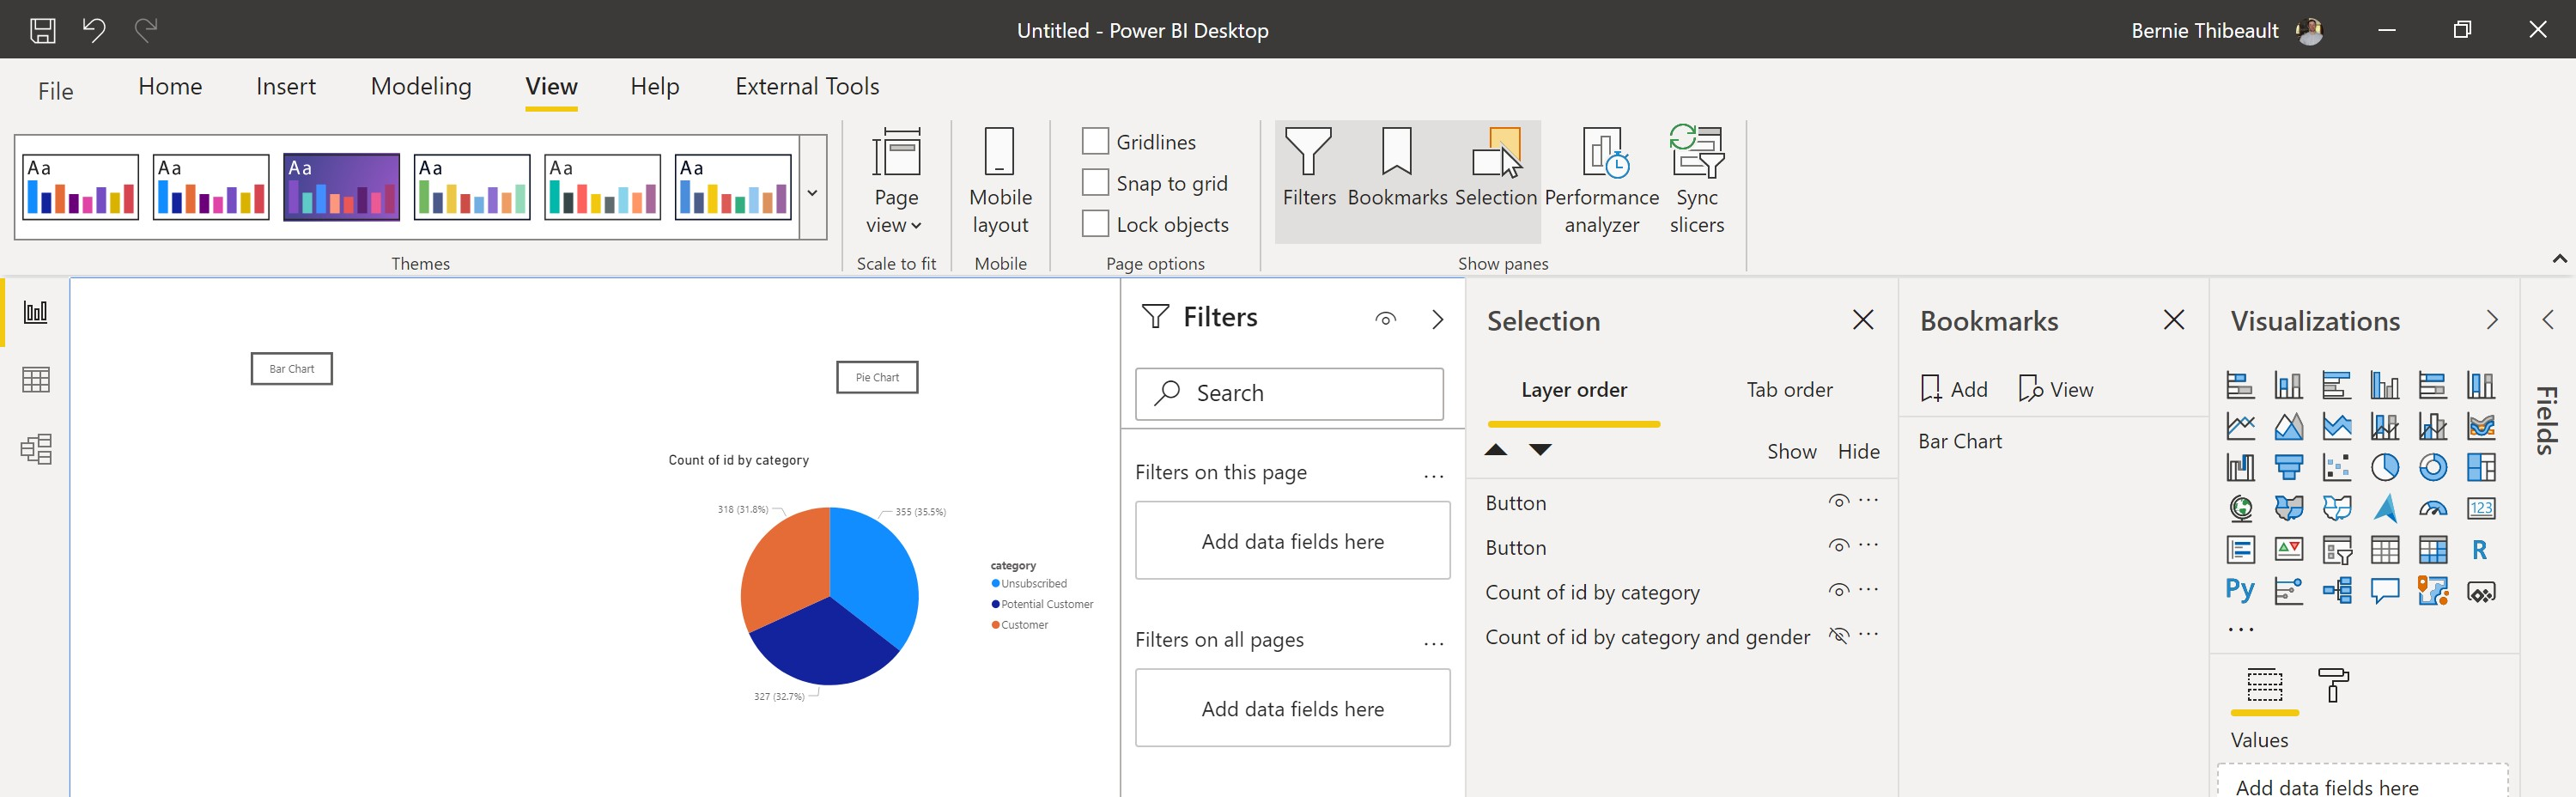
Step 3: Open the Selection Pane from your View menu
This is an important and rarely-used feature of Power BI. The selection pane allows you to see all the visuals on your screen and set their visibility.
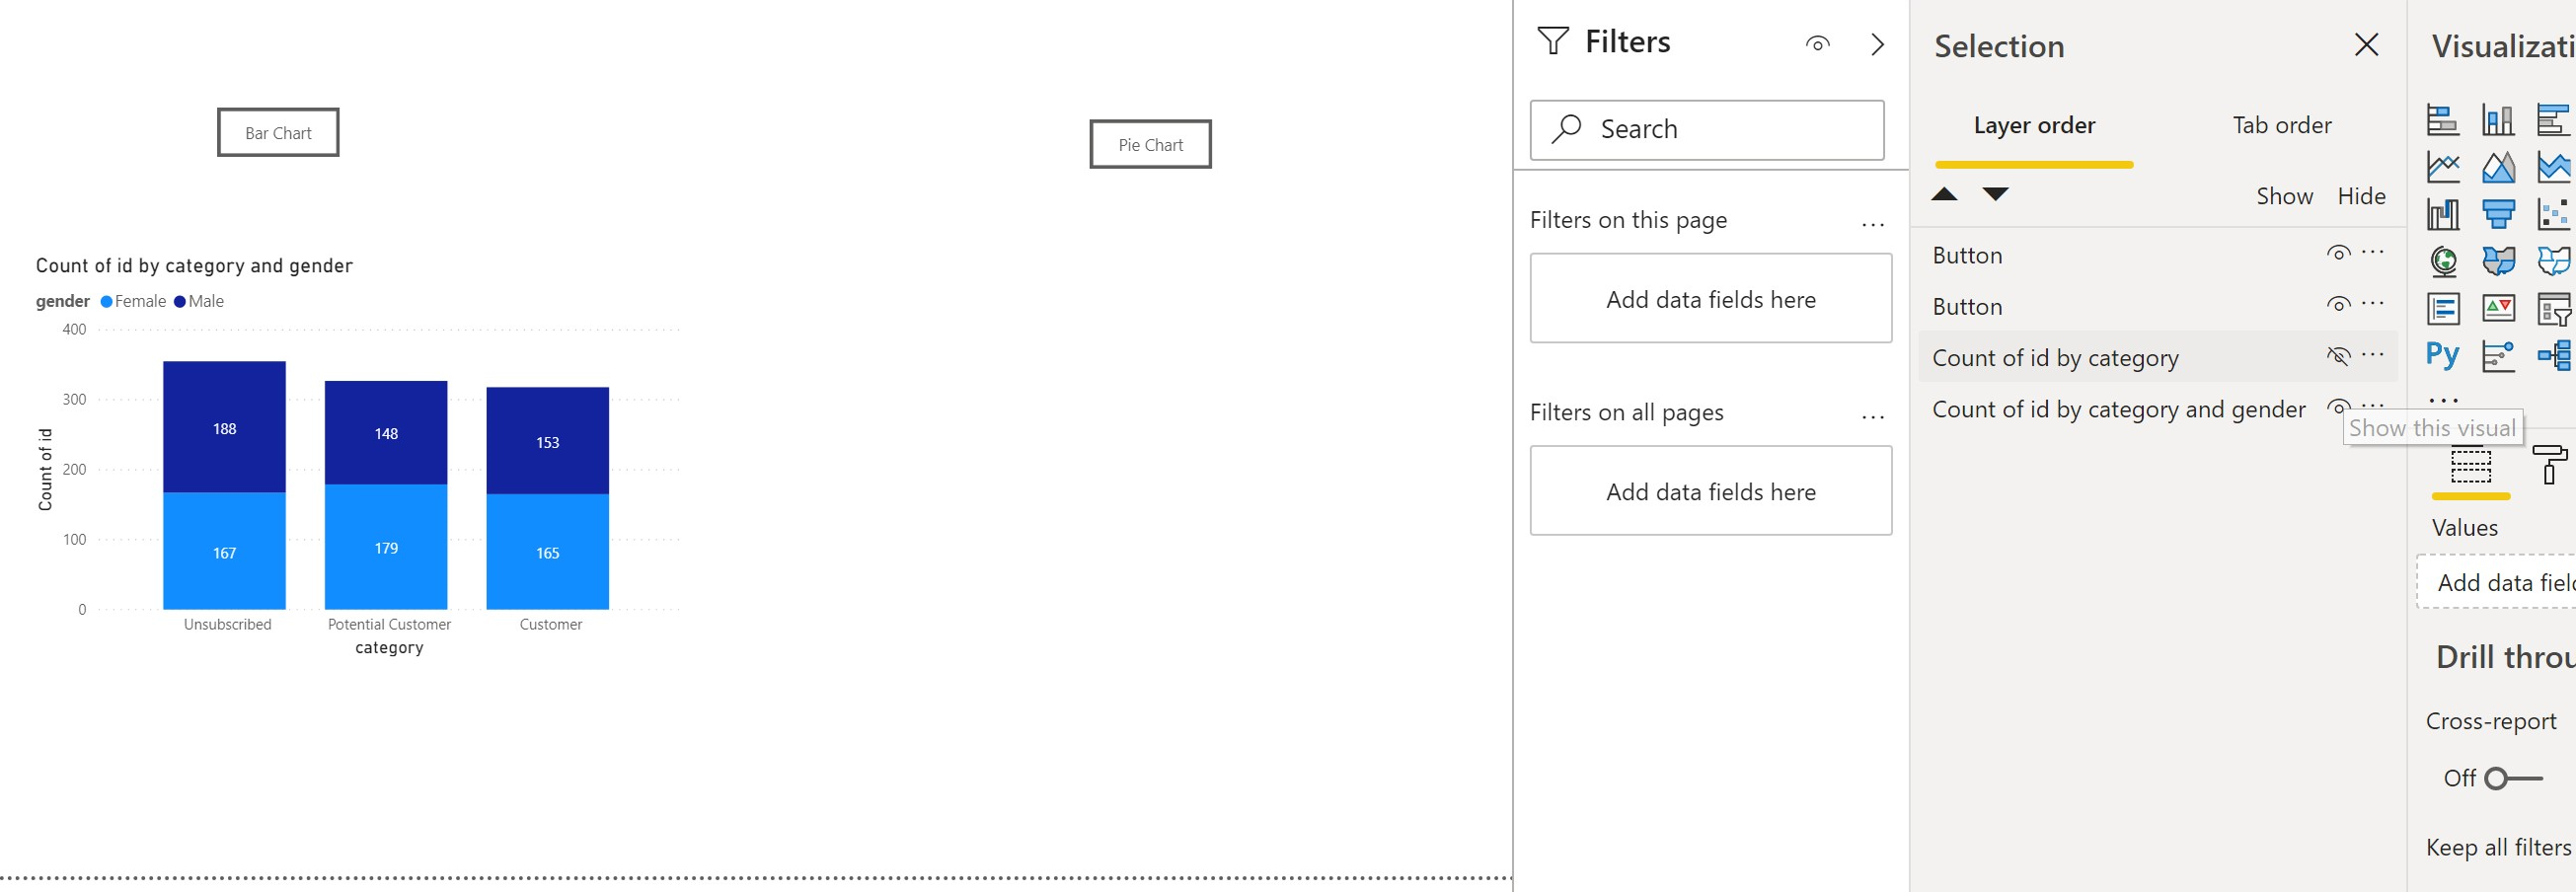
Step 4: Hide one of the visuals
Click on the visibility icon next to the visual you would like to hide.
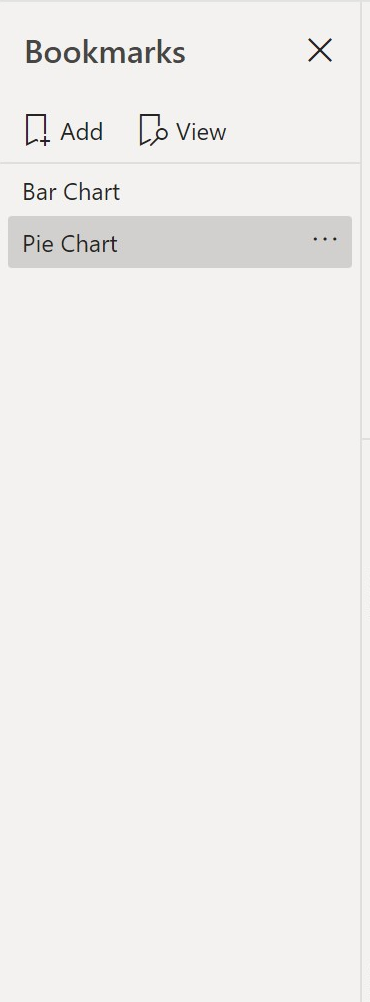
Step 5: Open the bookmark pane
Another little-used feature of Power BI. Read more about the capabilities of bookmarks here. For the purpose of this demo, we are using them to hide and show different visuals on the canvas.
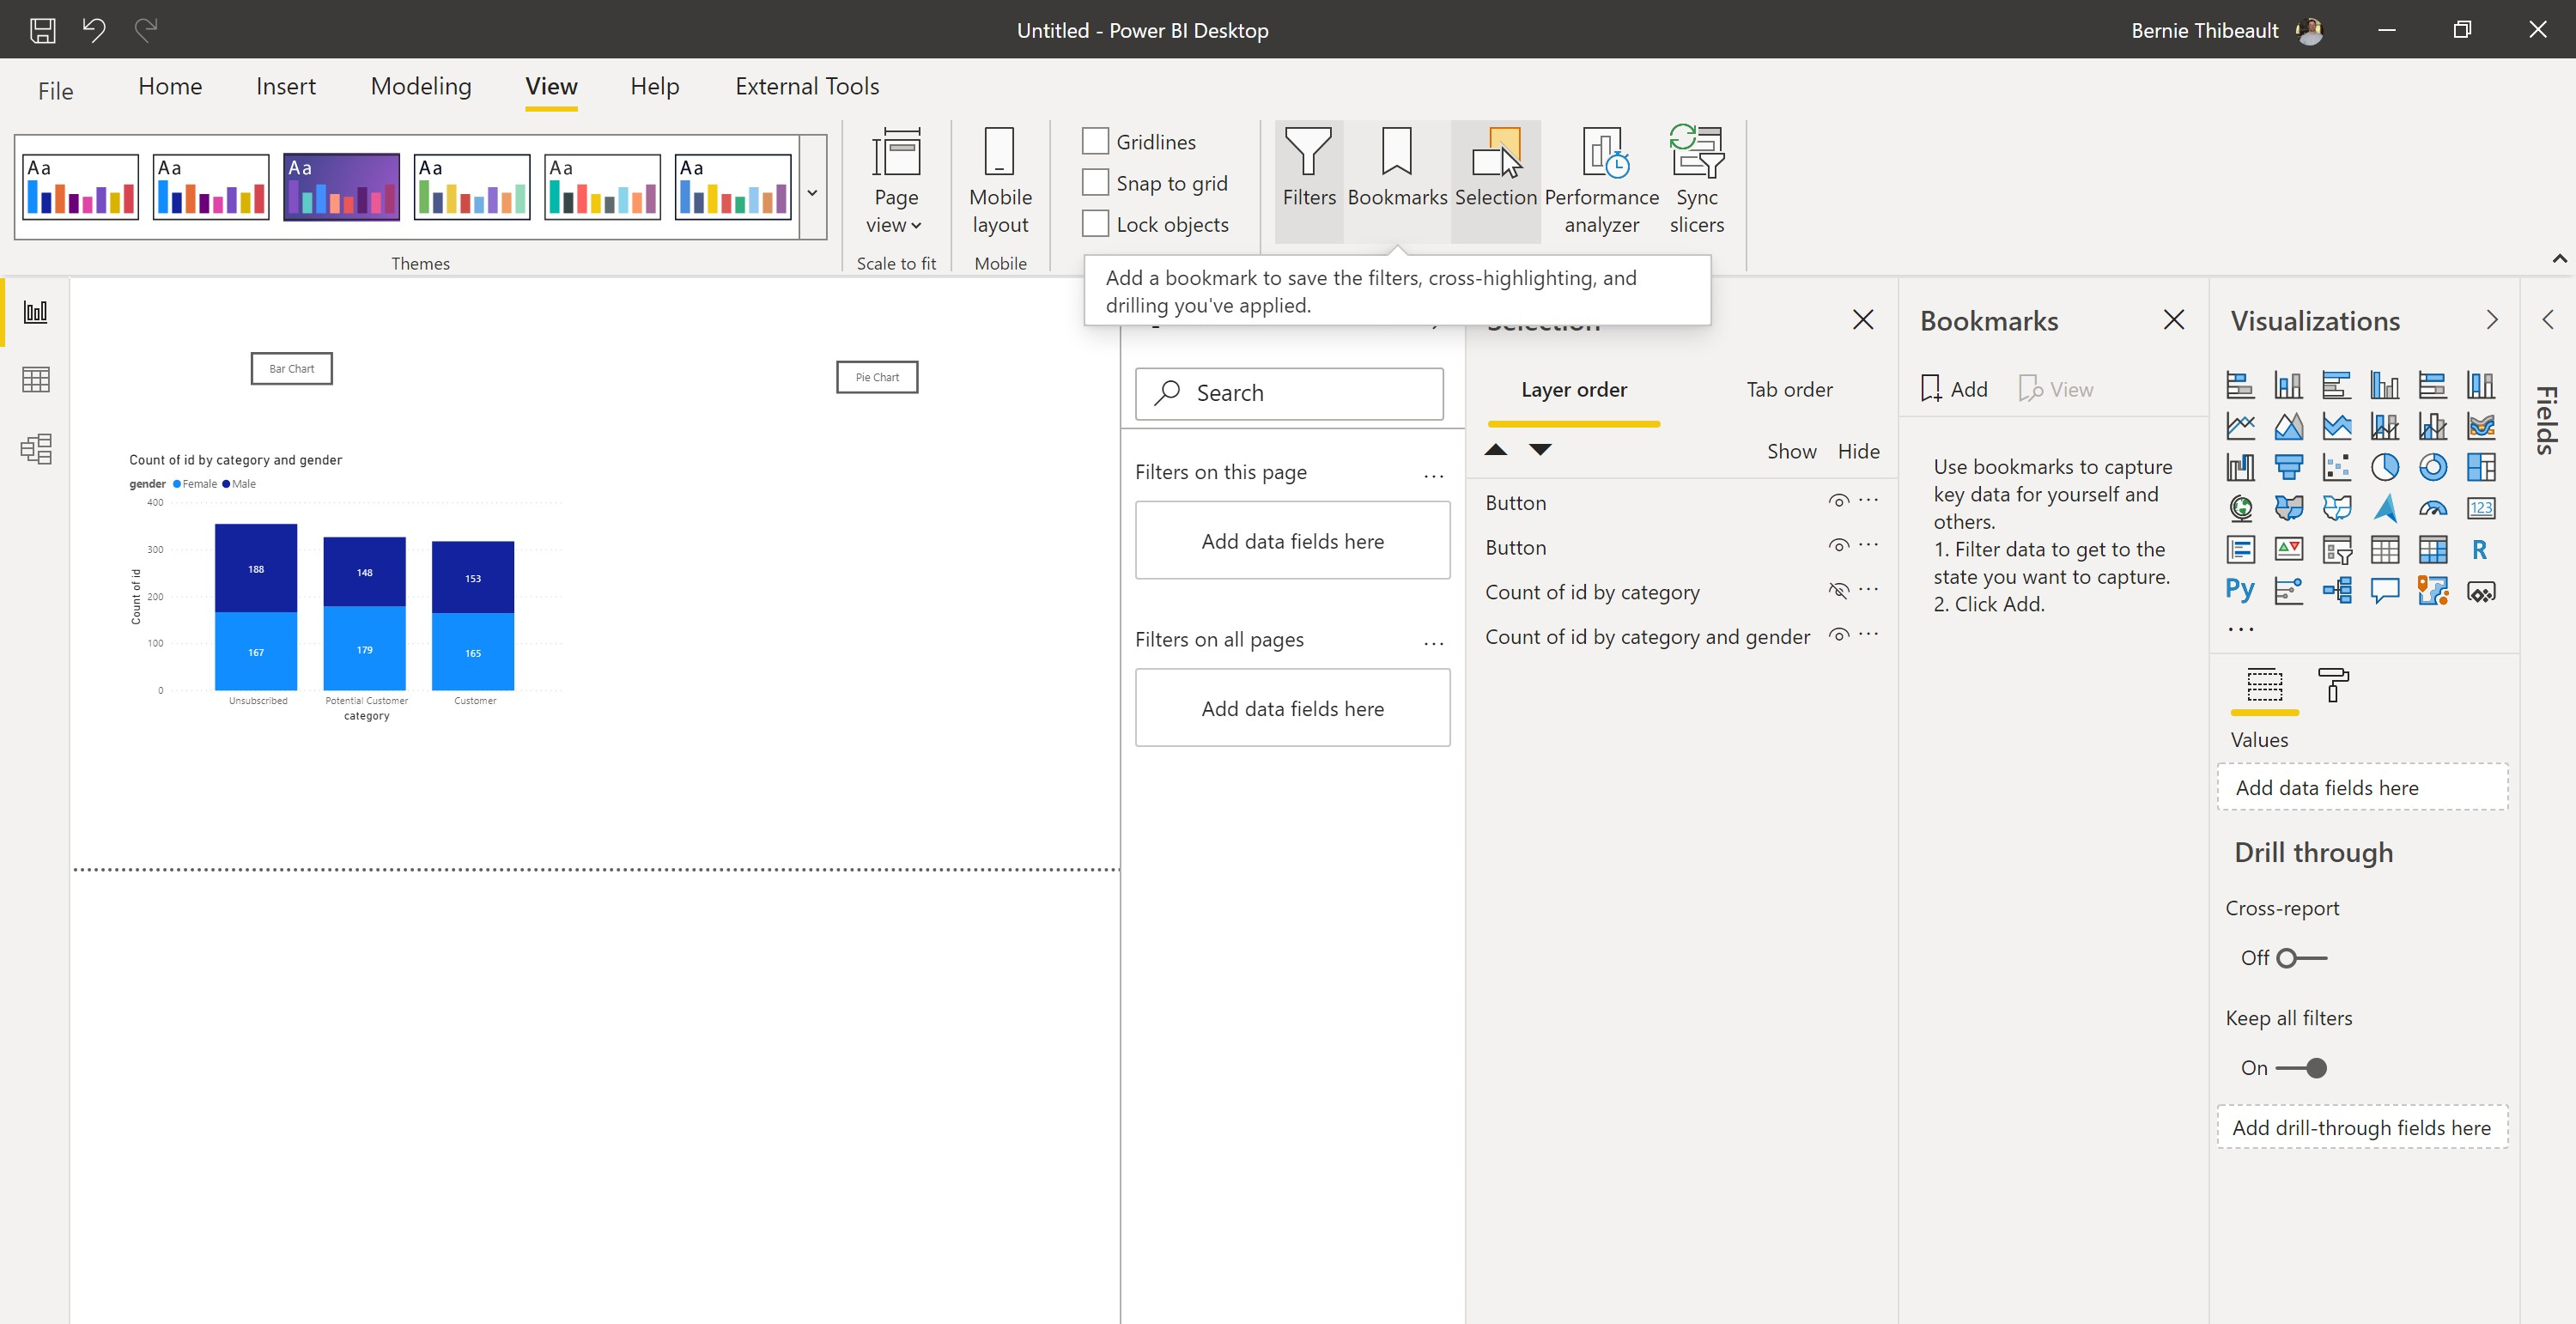
Step 6: Create a new bookmark
This will essentially take a screenshot of what your report page looks like at the time of adding the bookmark, you can always update it later. Make sure to name your bookmark something useful, and uncheck the "Data" item.
Step 7: Hide the other visual and show the one you previously hid
Go back to your selection pane and hide one visual while showing the other.
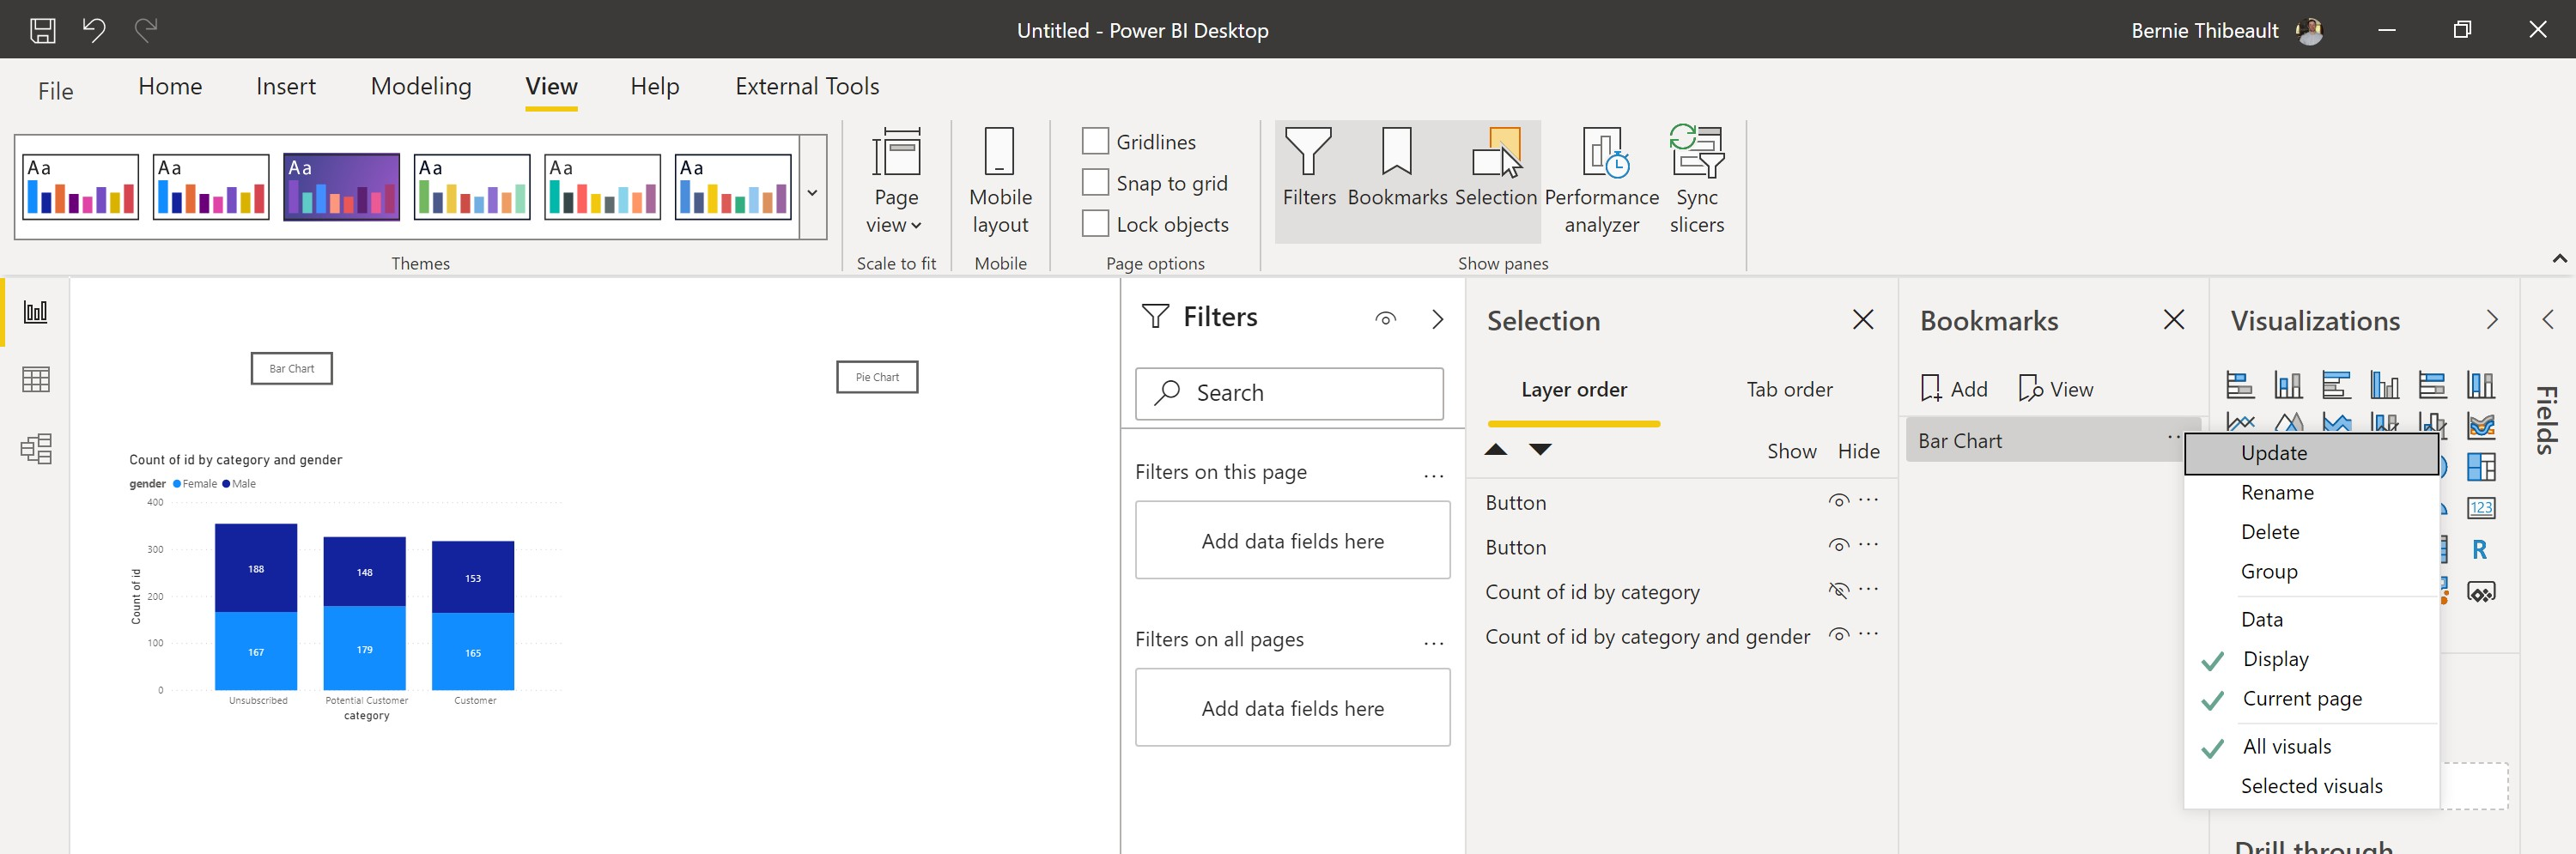
Step 8: Take another bookmark
Follow the same steps as in Step 6.
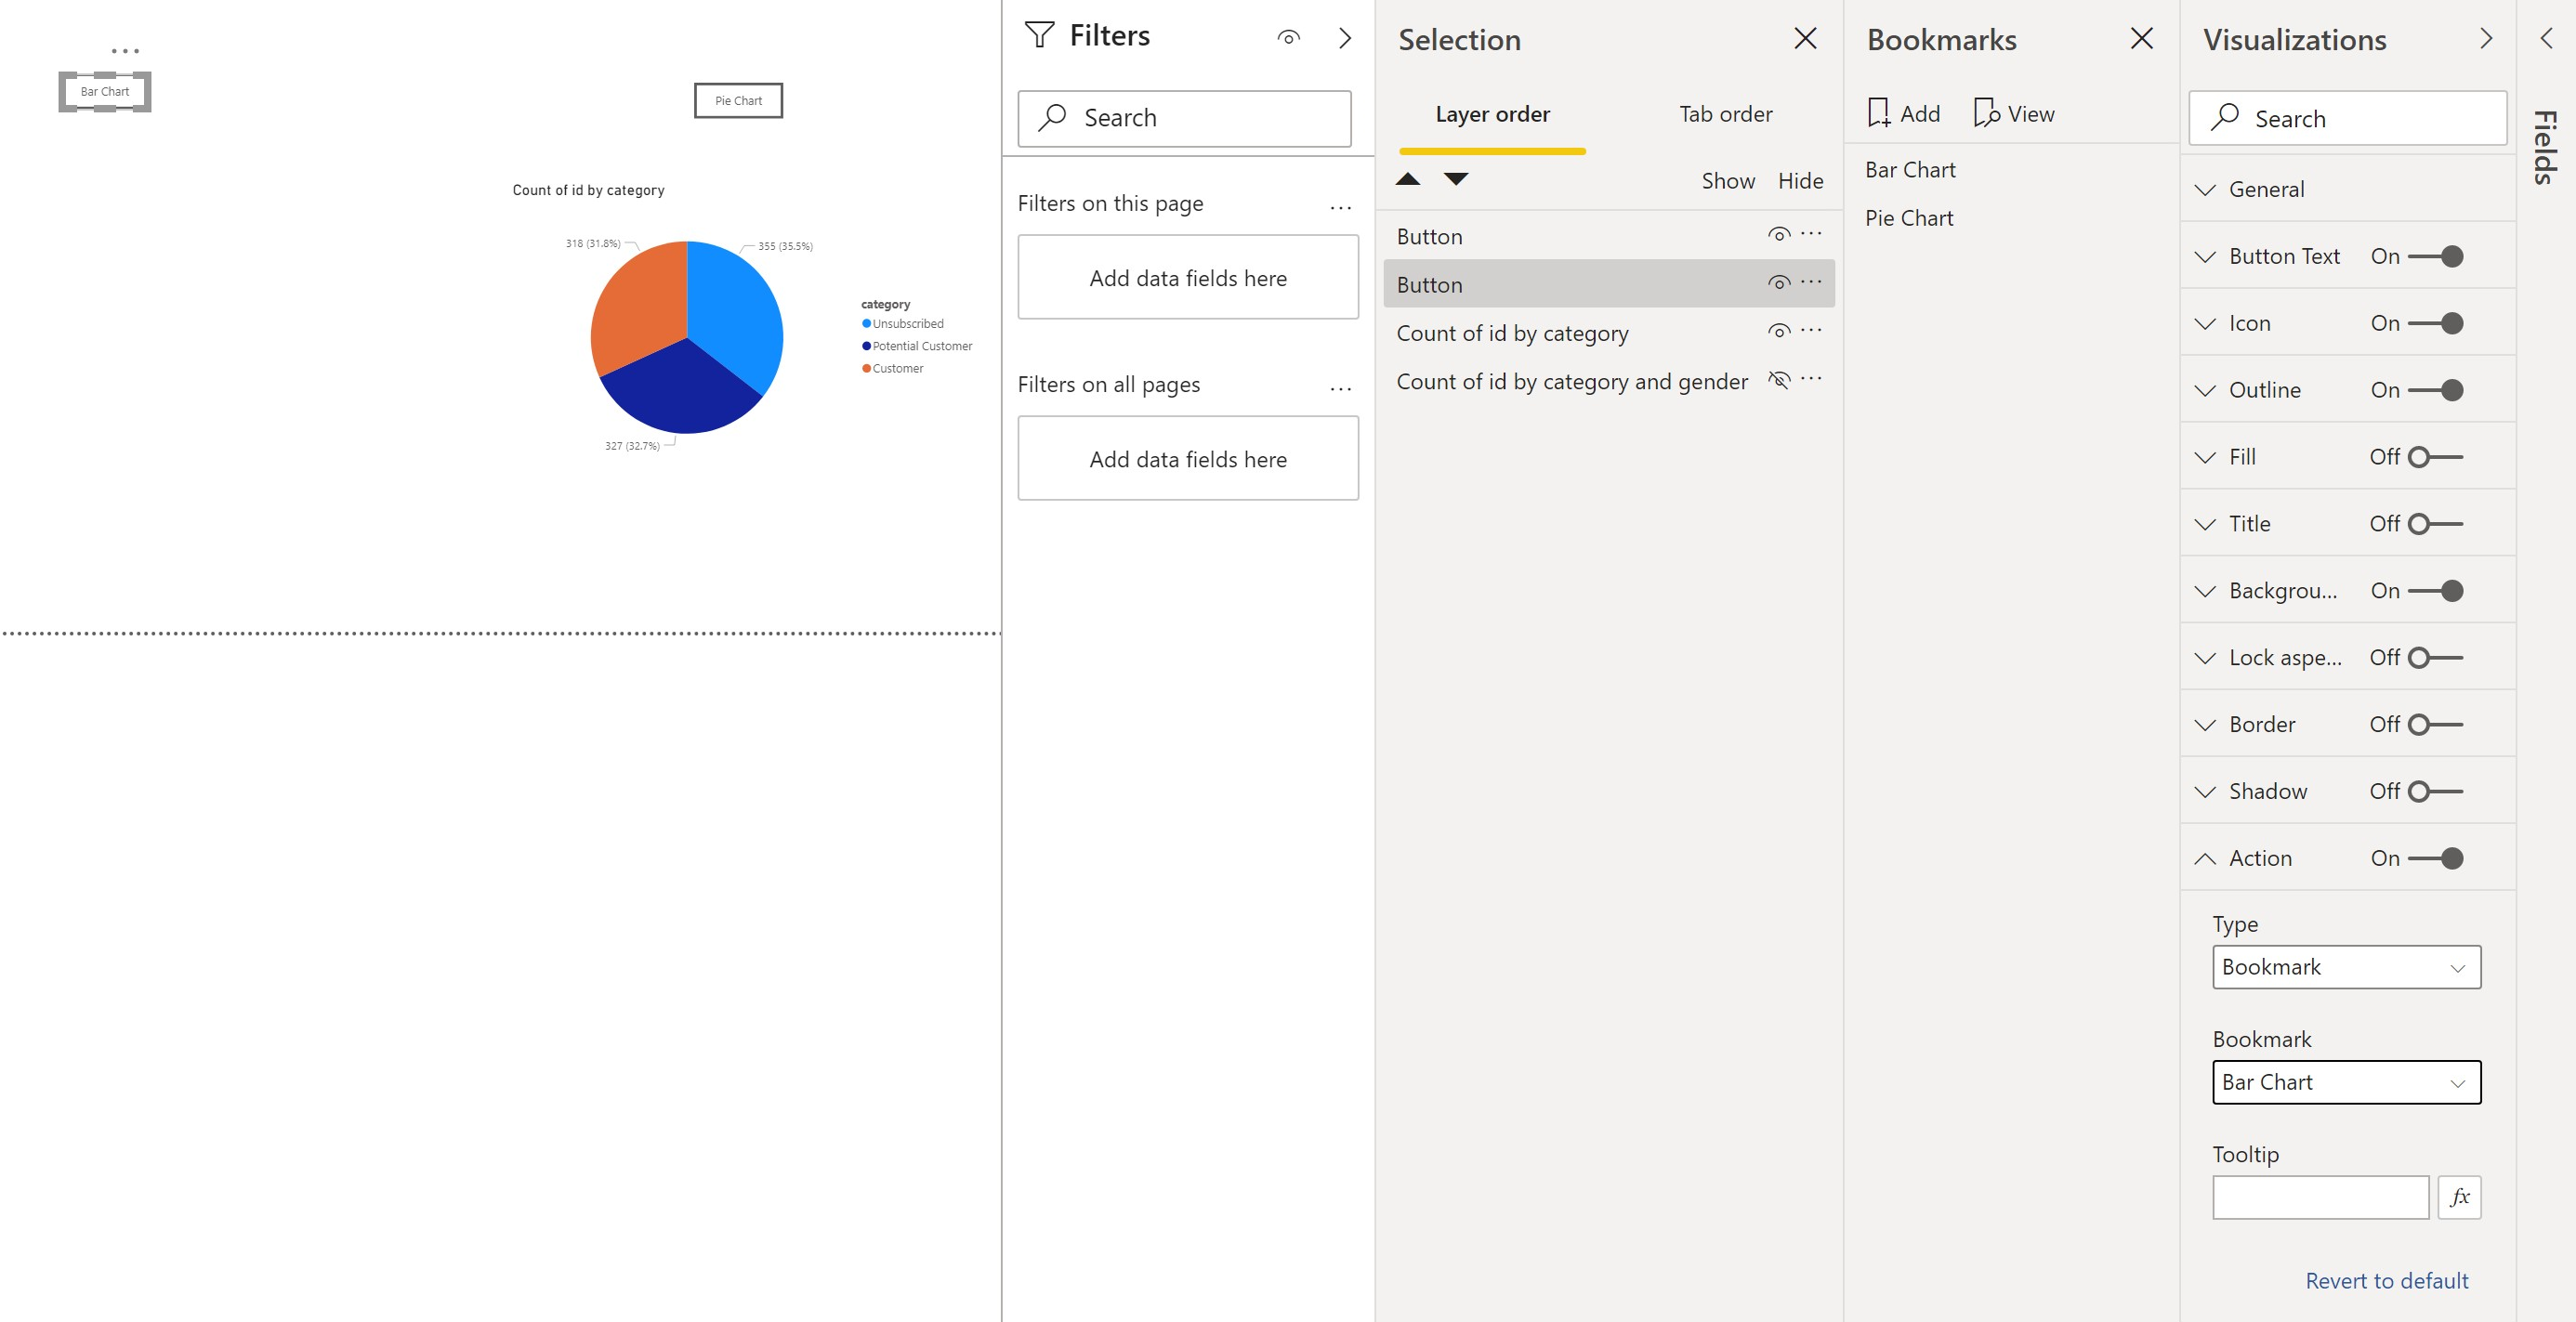
Step 9: Add a bookmark action to the buttons that you have on the canvas
This is where the canvas will come to life, now your visuals will be hidden and shown based upon the users' click of the buttons. Hold the control button and click the buttons to test out your creation!
I hope you found this helpful and can apply it to your next report!