Dynamics 365 is a great tool on which to build any of your business applications. Buying a license will spin up an instance already configured with Sales, Customer Service, Field Service and Project Management modules. They all have the standard Dynamics dashboards and reports. But how do you know when you need to customize those reports, or better yet, upgrade your reporting to Power BI?
Dynamics Dashboards
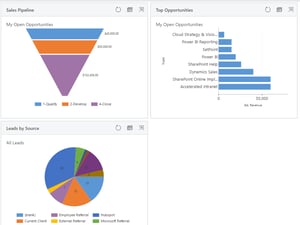
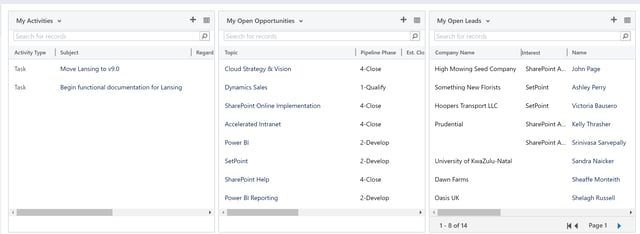
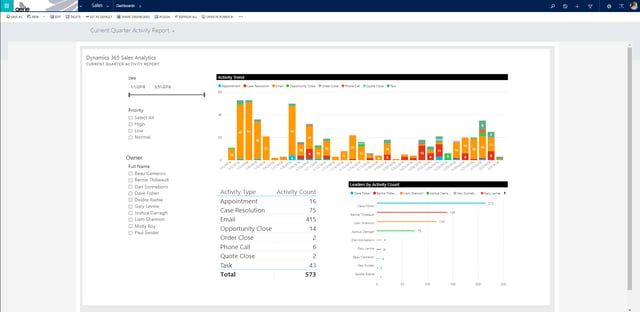
Dynamics dashboards are great for listing out the information a user may need to see: such as their open leads, opportunities, and cases. This is information a user might need to have easy access to, with on-screen reminders like “I forgot to follow up on this lead last week, I should check in today.” You can click into this dashboard to go right to the lead’s information so that you can call or send an email. Having access to those records in one click is incredibly useful.
Where the advantages of Dynamics dashboards starts to fall off is in visualizations; they leave quite a bit to be desired. Not being able to pick colors can cause bar charts to become confusing, and pie charts to look undesirable. You are also limited to bar, line, pie, area and funnel charts, so you are not able to create more complex visuals such as map visualizations or bar-line chart combinations.

Power BI Dashboards
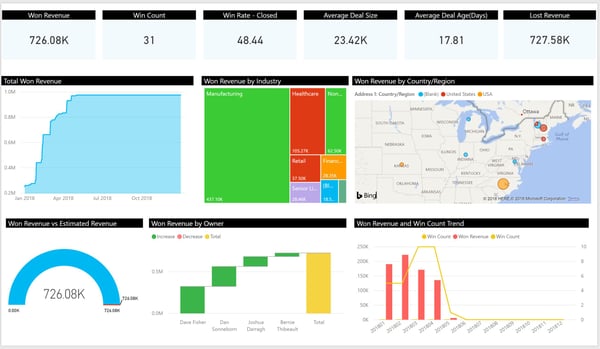
This is where Power BI comes in. It gives you the ability to make incredible, interactive visualizations. If you are a sales manager, you may not need to see the information on an individual record basis, but you want to see the whole picture. How much revenue are we forecasting by region? What is our Won vs Estimated revenue? Who has been falling behind on their sales activity? The best part is that these reports are available in Power BI content packs, so you will need to do little to no configuration!
In just a few steps you can integrate your Power BI dashboard right into Dynamics 365. Any dashboard you want can be added into the system and you can slice and dice the reports any way you want. Read my blog on how to do this.
For more information about Aerie's Power BI Services or if you would like help integrating Power BI with Dynamics 365, please feel free to reach out to Bernie at bthibeault@aerieconsulting.com or leave a comment below!
Share