Visualizing data in SharePoint Apps is simple when combining SharePoint 2013 REST API and Chartjs.org. ChartJS is a JavaScript library that uses HTML5 canvas to turn your boring old SharePoint data into beautiful and animated charts and graphs.
I created a SharePoint hosted app for managing HelpDesk tickets. The app contains a SharePoint list called ‘Tickets’ which holds relevant information for help desk personnel to resolve new work orders. For this post, let’s focus on a column in our Tickets list called ‘Status’, where the Status of a ticket can be Open, Pending and Closed. What we’d like to do is take all of the list items and using ChartJS show a nice visual representation for the number of tickets by Status.

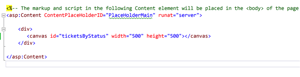
The HTML
We’ll start by downloading ChartJS and including the chart.min.js as a new file into our Visual Studio solution.
As mentioned before, ChartJS uses HTML Canvas to render our data. Canvas is supported in all modern browsers and polyfills support for IE7 and IE8. ChartJS only requires a Canvas element for visualizing our SharePoint data. Easy!
Getting the Data
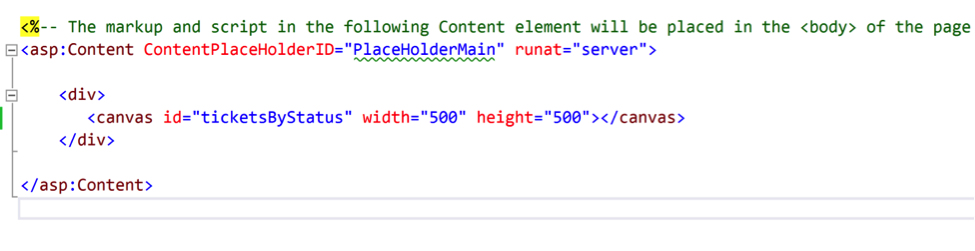
One of the best features in SharePoint 2013 is the Representational State Transfer (REST) interface that opens up SharePoint 2013 for use with popular web technologies and languages. The REST interface in SharePoint allows us to use the Client Object Model to access data within SharePoint using JavaScript. For more information on SharePoint 2013 REST check out this link.
Here is our REST call
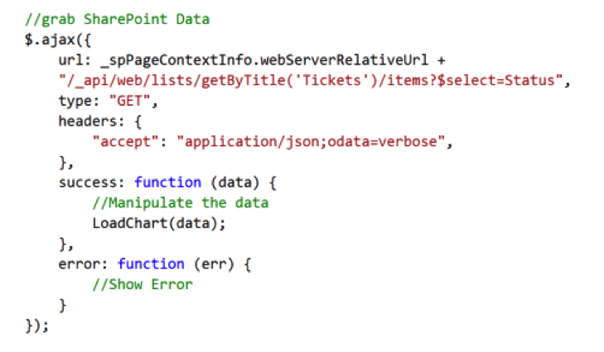
The LoadChart function
The code above takes the data from our REST call and finds out which type of statuses are available in our Status choice field. Once we have figured out the unique types, we then loop through our original set of REST data and filter out the items for each status and calculate the number of occurrences using the JavaScript length property.
In this sample, I’ve used the Doughnut layout from ChartJS. When executing this sample the result is a beautiful and elegant Chart that brings our boring old SharePoint list data to life!

Share